You craft a funnel to take visitors from an introduction to conversion. But does your content actually do that?
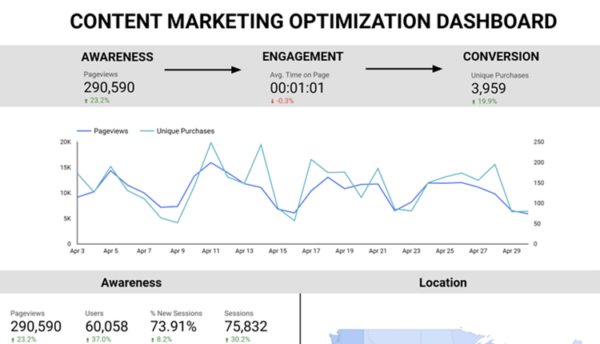
I created a template in Looker Studio (formerly Google Data Studio) you can use to visualize the full-funnel impact of your content marketing initiatives. By looking at awareness (page views), engagement (average time on page), and conversion metrics (unique purchases) together, you can more clearly see the impact of an increase or drop in numbers at any of the stages.
The dashboard works with both Google’s Universal Analytics and Google Analytics 4. But remember, Universal Analytics will stop processing data by July 1, 2023. You can learn about how to switch your analytics to GA4 here.
TIP: If you don’t already have your Google Analytics account integrated with Looker Studio, select “Create data source” and follow these instructions to connect your account.
Step 1: Connect to your data
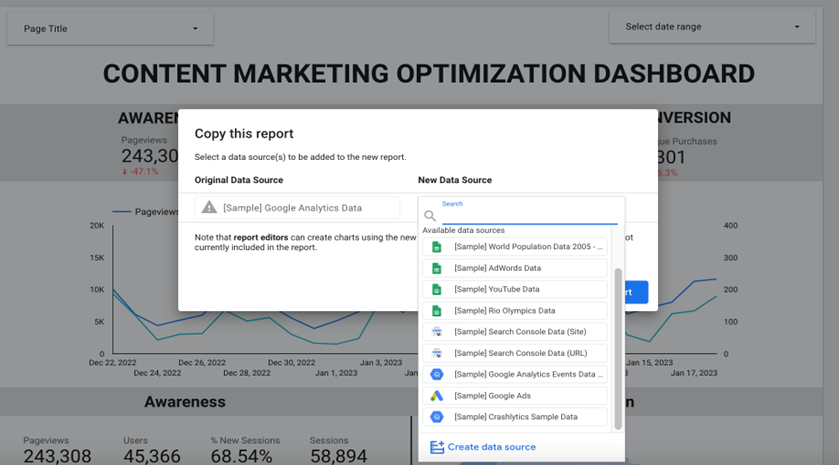
Make a copy of the template to replace the sample data with your own. Click on the three dots in the upper right corner and select “Make a copy.” A pop-up prompting the selection of a data source will appear. Scroll down to “Create data source.” Pick the analytics system you use now.
Step 2: Customize your dashboard
With your data connected, the dashboard automatically shows the awareness and engagement categories based on your Google Analytics metrics.
TIP: Compare your dashboard with the template to ensure the right metrics were selected. In switching the sample data to your own, Looker may have erroneously selected metrics not included in the original template.
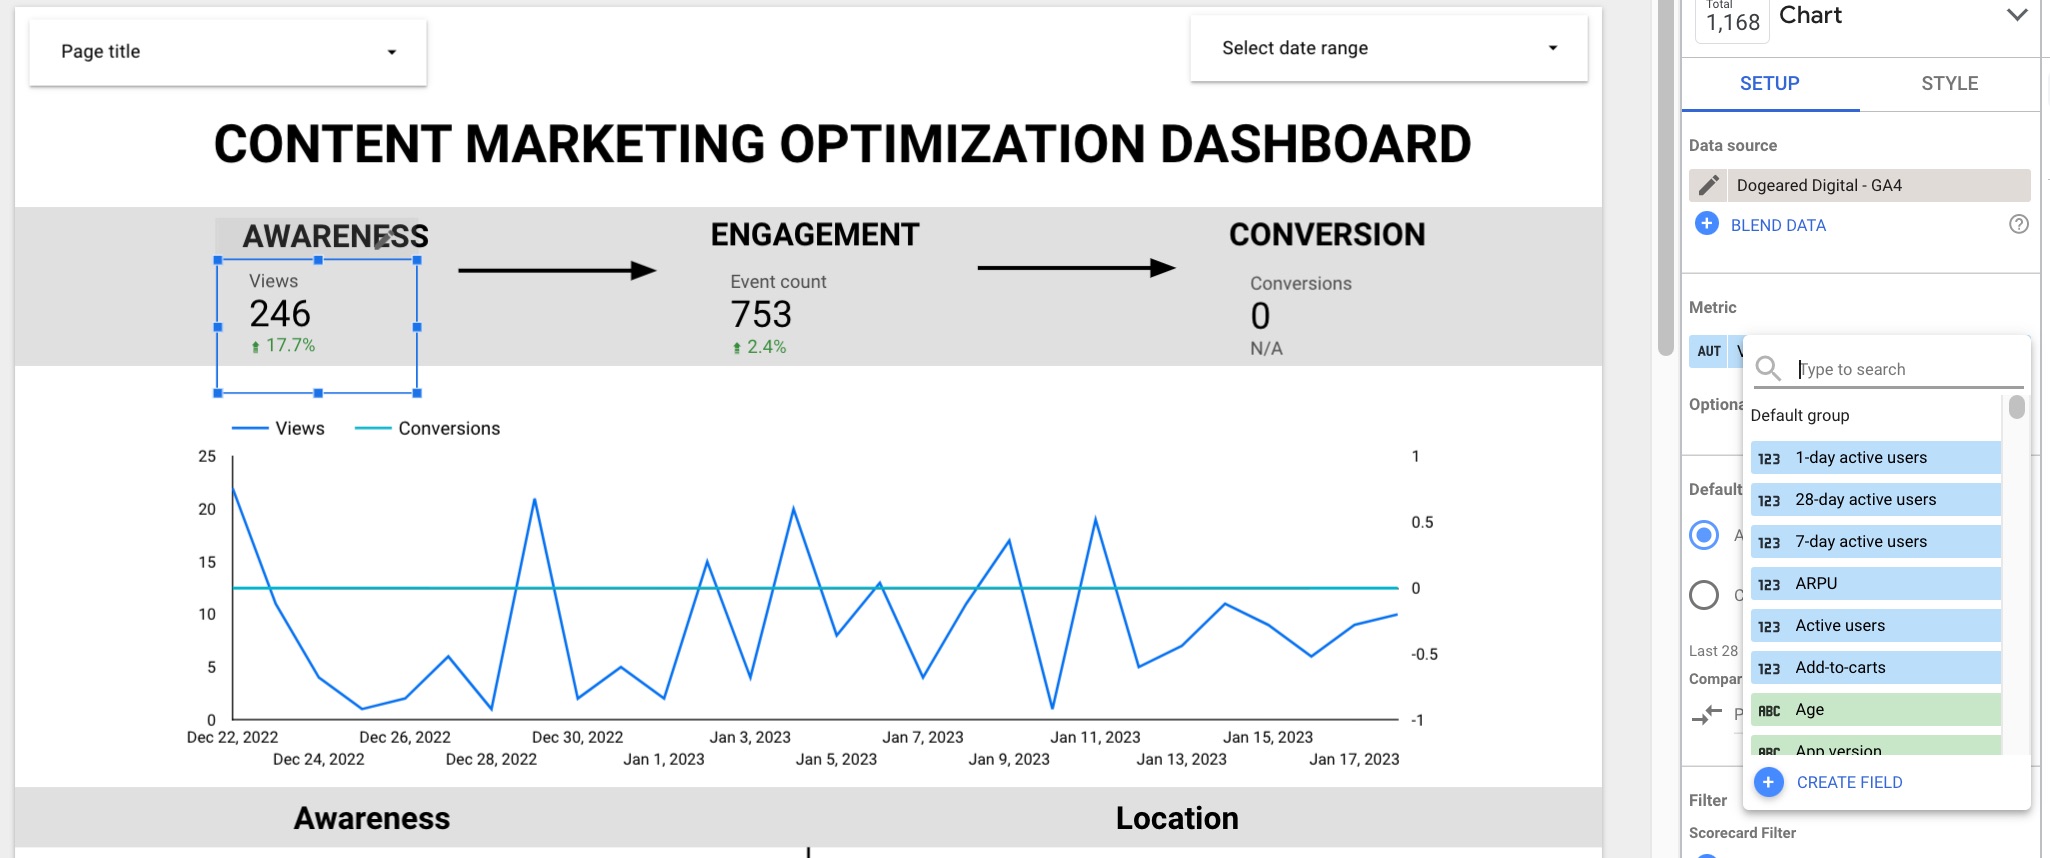
You also can visualize different metrics by customizing the dashboard. Click on the metric you want to change and select the preferred metric from the drop-down chart setup menu on the right.
Step 3: Set up custom conversion events
The conversions in the template used custom events in the sample Google Analytics data set – unique purchases, conversion page views, and total value. When you switch to your data source, these metrics will not update.
If you have custom conversion goals and events set up in your Google Analytics account, you can add them to the conversion section as you did with the awareness and engagement sections. However, if not, you should set up conversion events or goals in your Google Analytics account before they can be added to your dashboard by following these instructions.
Some conversion metrics, however, can be created directly in your Looker dashboard with the filter feature. This is particularly useful when you want to set up data just for pages or parts of your website.
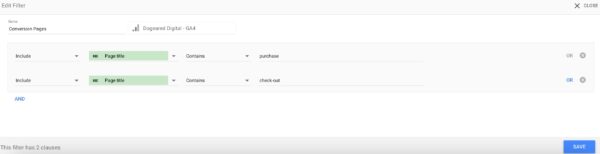
For example, you can add “conversion page views” to your dashboard using this method:
- Click “add a filter” and then “create a filter” in your chart setup menu.
- Select “page title” and add all titles of your conversion pages, such as product pages, shopping carts, booking pages – anything that makes sense for your business. (Visits to pages with conversion intent are more valuable than other page views on your website because they signal the user is considering making a purchase.)
- Name the filter and save it. (My filter is named conversion pages.)
Read More at Content Marketing Institute